There are a plethora of managed funds in Australia, some large and well diversified, some small and concentrated. Some invest across numerous industries while others are industry and/or asset class specific. The same applies to the “superannuation funds” sub-sector of the managed fund industry. As per The Australian Prudential Regulation Authority (APRA)’s Annual Superannuation Bulletin 2015, there were 155 APRA-regulated RSE licensees managing 242 funds with $1,246 billion under management.
Expected Rate of Return:
Since there are a wide variety of Managed Funds there would also be a wide range of rate-of-return expectations. Nevertheless, it may be useful to consider the average rates-of-return generated over the past 5 and 10 years (to June 2015) by various types of superannuation funds as an industry.
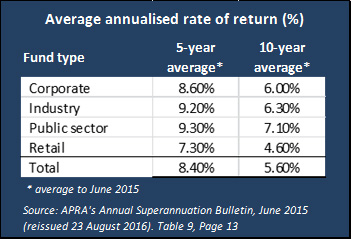 According to the APRA Statistics – Quarterly Superannuation Performance (June 2016), the various fund types in 2016 all delivered a result less than the 5 and 10-year averages set out in the table above. The 5-year average annualized return to June 2016 in respect of each fund type was lower than the 5-year average set out in the table above. The Corporate Fund’s average annualized return dropped to 7.4%, Industry Funds to 8.2%, Public Sector Funds to 8.2% and Retail Funds to 7.4%, with all funds dropping to 7.4%.
Given the risk-free rate was higher 5 and 10-years ago that its current level (October 2016), it would be rather difficult to justify any expectation that the Managed Fund Industry will generate a return over the next 5 to 10 years that is equal to or exceeds the sum of the risk-free rate and 4% to 6% pa (currently around 6% to 8% pa).
The Risk Rxpected:
APRA’s Annual Superannuation Bulletin, June 2013 (revised 5 February 2014) gave some insight into the volatility of investments in the funds management industry. It set out the average annualized rate of return over the ten years to June 2013 generated by the industry as a whole (but limited to Funds with at least 4 members) and by various fund types. It also set out the volatility of those investments over that period.
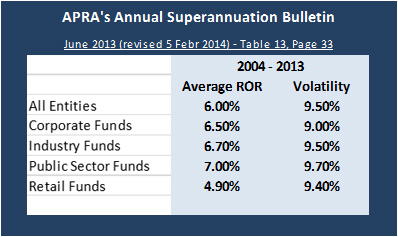 This table appears to show that the average annualized rate of return over the 10-year period to June 2013 for each of the 4 major industry types and for the funds management industry as a whole was lower than the volatility in their value over the same period. In other words, it appears to show that the risk is greater than the return.
As there are many managed funds with differing size, industry, investment mandates and concentration levels it could be useful to consider the year-by-year performance of various S&P/ASX indexes. While doing so may give one some insight into the risk associated with an index fund, it may also provide insight in to the risk that one might expect from investing in a well-diversified managed fund that has invested heavily in Australian equities.
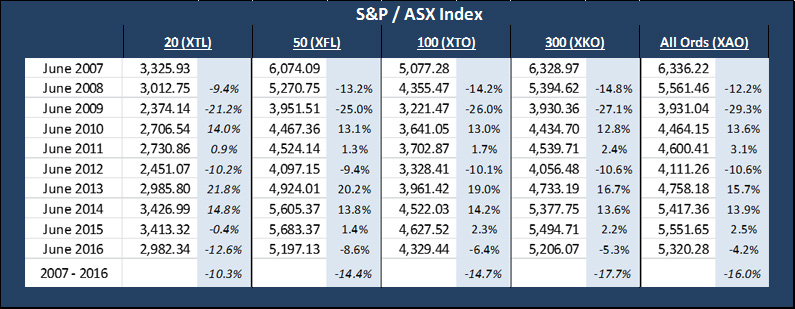
What I found interesting about this table was that not only has each index dropped over the past 10 years, but that the drop in prices was so extensive, ranging from 10% to almost 18%. I was also surprised at the extent of the year-on-year volatility. This leads me to conclude that even investing in an Index Fund, which by definition is well diversified, is high risk. One faces the real prospect of losing some of one’s capital.
Expected Return-for-Risk:
An expected ‘text book’ return on investment of 6% to 8% pa at the time of writing (which probably overstates the market’s expectation by a couple of percentage points) is low bearing in mind that year-on-year price reductions have at times significantly exceeded the expected return on investment. In other words, the risk appears to be a lot higher than the return one could reasonably be expected to earn on such an investment.
Prepared by: Mark Morris